 AnyChart Stock and Financial Flash Chart 1.1.0
AnyStock is a flexible Flash-based solution to create interactive and attractive stock and financial charts with large datasets support and great scrolling options. XML/JSON interface, technical indicators and drawings, full localization support.
Last update
12 May. 2011
Licence
Free to try |
$899.00
OS Support
Windows 98
Downloads
Total: 1,203 | Last week: 2
Ranking
#226 in
Web Design Tools
Publisher
Anychart.com
Screenshots of AnyChart Stock and Financial Flash Chart
AnyChart Stock and Financial Flash Chart Publisher's Description
AnyChart Stock Component is a fully functional solution for solving the broadest range of data visualization problems. The component has numerous advantages over similar software, which excel it as a unique stock and financial charting solution on the market. While working on its functionality, we strove to make it comfortable and easy, so that you could work out the most sophisticated visualization tasks for large sets of financial data with little or no effort.
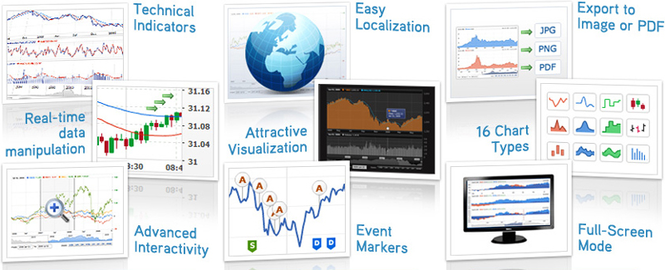
* Technical Indicators and Overlays - 12 fully customizable and automatically calculated technical indicators and overlays, which can be configured to suit your demands: Simple Moving Average, Exponential Moving Average, Bollinger Bands, Money Flow Index, MACD, Parabolic SAR, Rate of Change, Relative Strength Index, Stochastic Oscillator, Volume, Volume+MA, Williams %R
* Real-Time Data Streaming and Data Manipulations - a full feature set for creating real-time streaming and data manipulation applications. The Java Script library that comes with the component has methods that allow adding, updating, removing or inserting new data points or range of points.
* Advanced Interactivity, Rich Zooming, Scrolling and Navigation Options - all navigation elements meet all the industry's usability standards and are very comfortable in use.
* Drawing Tools for Technical Analysis -A complete list of drawing tools, giving end users an ability to add drawings to a chart such as Line segment, Ray, Trend line, Vertical Line, Horizontal Line, Rectangle, Ellipse, Triangle, Trend channel, Andrew's pitchfork, Fibonacci fan, Fibonacci arc, Fibonacci retracement, Fibonacci time-zones, Buy/Sell signals, Custom text labels and so on.
* Rich API, XML/JSON interface support
* Attractive and Flexible Visual Settings
* Export Chart as JPG, PNG or PDF
* Fourteen Chart Types, All Combinable
* Event Markers
* Advanced Date-Time Formatting
* Full Screen Mode
* and many other useful and exciting features.
What's New in Version 1.1.0 of AnyChart Stock and Financial Flash Chart
* Drawing tools and annotations * Flex Component * Improvements o Missing points control o adjust_margins for Candlestick, OHLC and Bars o RangeArea, RangeSplineArea or RangeBar types to visualize Bollinger Bands o Event markers position settings o Default template included in documentation
Look for Similar Items by Category
Feedback
- If you need help or have a question, contact us
- Would you like to update this product info?
- Is there any feedback you would like to provide? Click here
Popular Downloads
-
 Kundli
4.5
-
 Macromedia Flash 8
8.0
-
 Cool Edit Pro
2.1.3097.0
-
 Hill Climb Racing
1.0
-
 Cheat Engine
6.8.1
-
 Grand Theft Auto: Vice City
1.0
-
 Grand Auto Adventure
1.0
-
 Tom VPN
2.2.8
-
 HTML To PHP Converter
6.0.1
-
 Zuma Deluxe
1.0
-
 Netcut
2.1.4
-
 Windows XP Service Pack 3
Build...
-
 Vector on PC
1.0
-
 Minecraft
1.10.2
-
 Ulead Video Studio Plus
11
-
 PhotoImpression
6.5
-
 Street Fighter 3
1.0
-
 Auto-Tune Evo VST
6.0.9.2
-
 Iggle Pop
1.0
-
 C-Free
5.0


